Last 2 years
Helping financial analysts find and handle the information needed in the due dilligence process.
About the product
I joined the Desia AI team when the company was 6 months old. One founder, a former Goldman Sachs analyst, had spent countless late nights gathering and cleaning financial data. The other, an experienced engineering leader from Advent, had built software for large investment firms.
Together, they believed they could simplify and automate the labour of analysts finding and checking data across so many sources, so that financial teams could work more efficiently, and with the help of an innovative, research paper-loving engineering team open to new AI technology, they started Desia AI.
My responsibilities
As the first and only designer and second product manager, I shaped product strategy and features from concept to delivery.
My responsibilities included:
Leading the research and design of the product
Designing the UX/UI through prototypes, wireframes, and Figma high fidelity designs
Co-planning the product direction and roadmap with Head of Product basing iterations on context understanding
Facilitating product workshops between teams to co-design products down to the technical details to discuss features and the action plan of each iteration
Designing and leading the development of the company’s design system
Overseeing the development of customer-faced features to ensure a high quality standard and adapt designs when needed to maximise technological advantage
When I joined, the team was working on a proof of concept of a chat interface where analysts would request financial information such as tables of financials, information about events, lawsuits. We wanted to create more than a ChatGPT chat interface, we wanted to develop the product to fit the process of Private Equity analysts and be ingrained in their day to day activities.
What problem are we really solving?
I needed to understand the problem space and have alignment with the team on clear goals. I studied training materials, watched 'day in the life' videos, and ran assumption workshops with colleagues with industry experience. I discovered knowledge gaps and varying hypotheses across our team about what problems were the most valuable to solve: the team was unsure what to prioritise or what clients would actually pay for.


I organised and conducted interviews with professionals of varying seniority levels across hedge funds, investment banking and private equity. I wanted to understand their current workflow, the level of variation between firm processes, and executives’ attitudes toward adopting AI technology.

The results brought us clarity and direction: analysts struggled to find reliable data, spent excessive time validating and cleaning it to match their firm's format, and expressed frustration at repetitive manual work. Funnily, people in the industry were complaining on Reddit about the same issues, such as fixing commas and checking that numbers were sourced from a reliable document. At the same time, executives were enthusiastic about innovation, but voiced strong concerns about data security when using competitor AI tools such as ChatGPT, Claude.ai, or Perplexity, meaning they wouldn't trust those websites to share internal data. Unlike public companies, access to private company data is restricted, meaning security absolutely needs to be in order.
After discussing my findings with the team, we defined three key objectives:
Expand and consolidate data coverage, to improve the accuracy of decisions
Verify and standardise data, to free up time for more valuable tasks
Ensure data security, to establish customer trust and protect confidential information
As the product designer, my focus was on the first two goals. The team has also worked on the third goal, which built trust with external clients meaning they started to share internal information which led to extended data coverage which contributed to the first goal too.
How do we design meaningfully with AI?
After discussing with clients about other solutions in the market and a journey analysis exercise I have found that the issues with AI were:
lack of source citation, with information shown without context or traceability
incorrect assumptions, when needing to conclude numbers based on calculations
difficulty in working with internal files, that need to be re-uploaded to be used across AI chats
A key area of exploration for me was how to design productive experiences around AI. Traditional product design assumes predictable outcomes, but AI introduces uncertainty as part of the experience: misinterpretations, incomplete data, and variable results are inevitable. Instead of treating these as failures, I reframed them as opportunities for design. Our approach shifted toward transparency, iteration, and continuous improvement, ensuring users understood when and why uncertainty occurred and how to act on it. By stating uncertainty about the validity of a figure on the platform, the user can understand what data is available and what each says and leverage their expertise to make better informed decisions.
Many of the challenges faced with AI are likened to the mistakes of an inexperienced analyst. By studying how analysts handle these issues, I identified opportunities to replicate the process at scale with AI. This understanding guided me and the product manager in thinking about our features and interfaces, and it guided the team in fine-tuning the logic behind our automations, as detailed later in this article.
Data coverage
Addressing the first problem of increasing data coverage, I began by mapping where analysts sourced their information. Research revealed they relied on a fragmented mix of systems:
internal storage: SharePoint, OneDrive, Google Drive, Dropbox
internal communications: Teams, Gmail
external databases: S&P database, Companies House (UK)
web: industry articles and filings
To support these workflows, I designed a flow that extended beyond web search, allowing users to upload internal files and sync their SharePoint or OneDrive folders. This gave analysts a single entry point to query their entire document ecosystem, whether looking for quantitative data (figures, dates, numbers) or qualitative context (names, events, lawsuits). Over time, we added support for additional external databases.
As the number of connected sources grew, the design challenge shifted from data access to information navigation. Analysts needed to switch quickly between multiple sources depending on the task at hand. I have continuously improved the designs through incremental changes based on user feedback, including setting common actions as defaults, grouping sources based on use, considering edge cases of general-specific selections of files.
During early-stage opportunity exploration, they compared large sets of sources at once.
During due diligence, they honed in on a few key documents.
For example, on the source selection flow below, my focus was to design an interface flexible enough to support both modes. The default is to enable all sources for a specific category, but the user can select specific types of sources, and even specific files.

Verifying and standardising data
Trading Comparables is a large table of calculated coefficients used to benchmark a company’s financials against peers. Junior analysts are often asked to double-check every source manually and leave footnotes for traceability. Drawing on research into how analysts select sources, I learned that credibility and recency were the most important factors. I surfaced the most relevant details directly in the interface.
Testing prototypes with additional sources, including public filings of financial papers, revealed that the category and type of filing should also be visible immediately, rather than only showing the article name and published date. Over time, I noticed that most of the critical data came from internal documents containing confidential information. To streamline workflows, I prioritised showing internal sources first while keeping visibility of other sources in a compact view of favicons.
After speaking to clients and seeing analysts use the tool, we have discovered that more detail was needed around the calculations that led to displaying certain financial figures. Analysts need to be able to cite every single calculation or source for any number, so I designed the UX to surface every calculation, and link it to its source document.

The next steps was exporting data: how do they store and save this data for further analysis? Each company has a preferred way of showing numbers, formatting tables, text that they export in branding PDFs. As this was a challenge for professionals spending too much time ‘cleaning up’ text and formatting layouts, I led the initiative of the FE team developing custom export options for each client’s template including: colours, branding, fonts, spacing. This was one of a few of my product management tasks where I worked with the team to iterate with small improvements that led to our clients working with data more efficiently.
Evolving the product
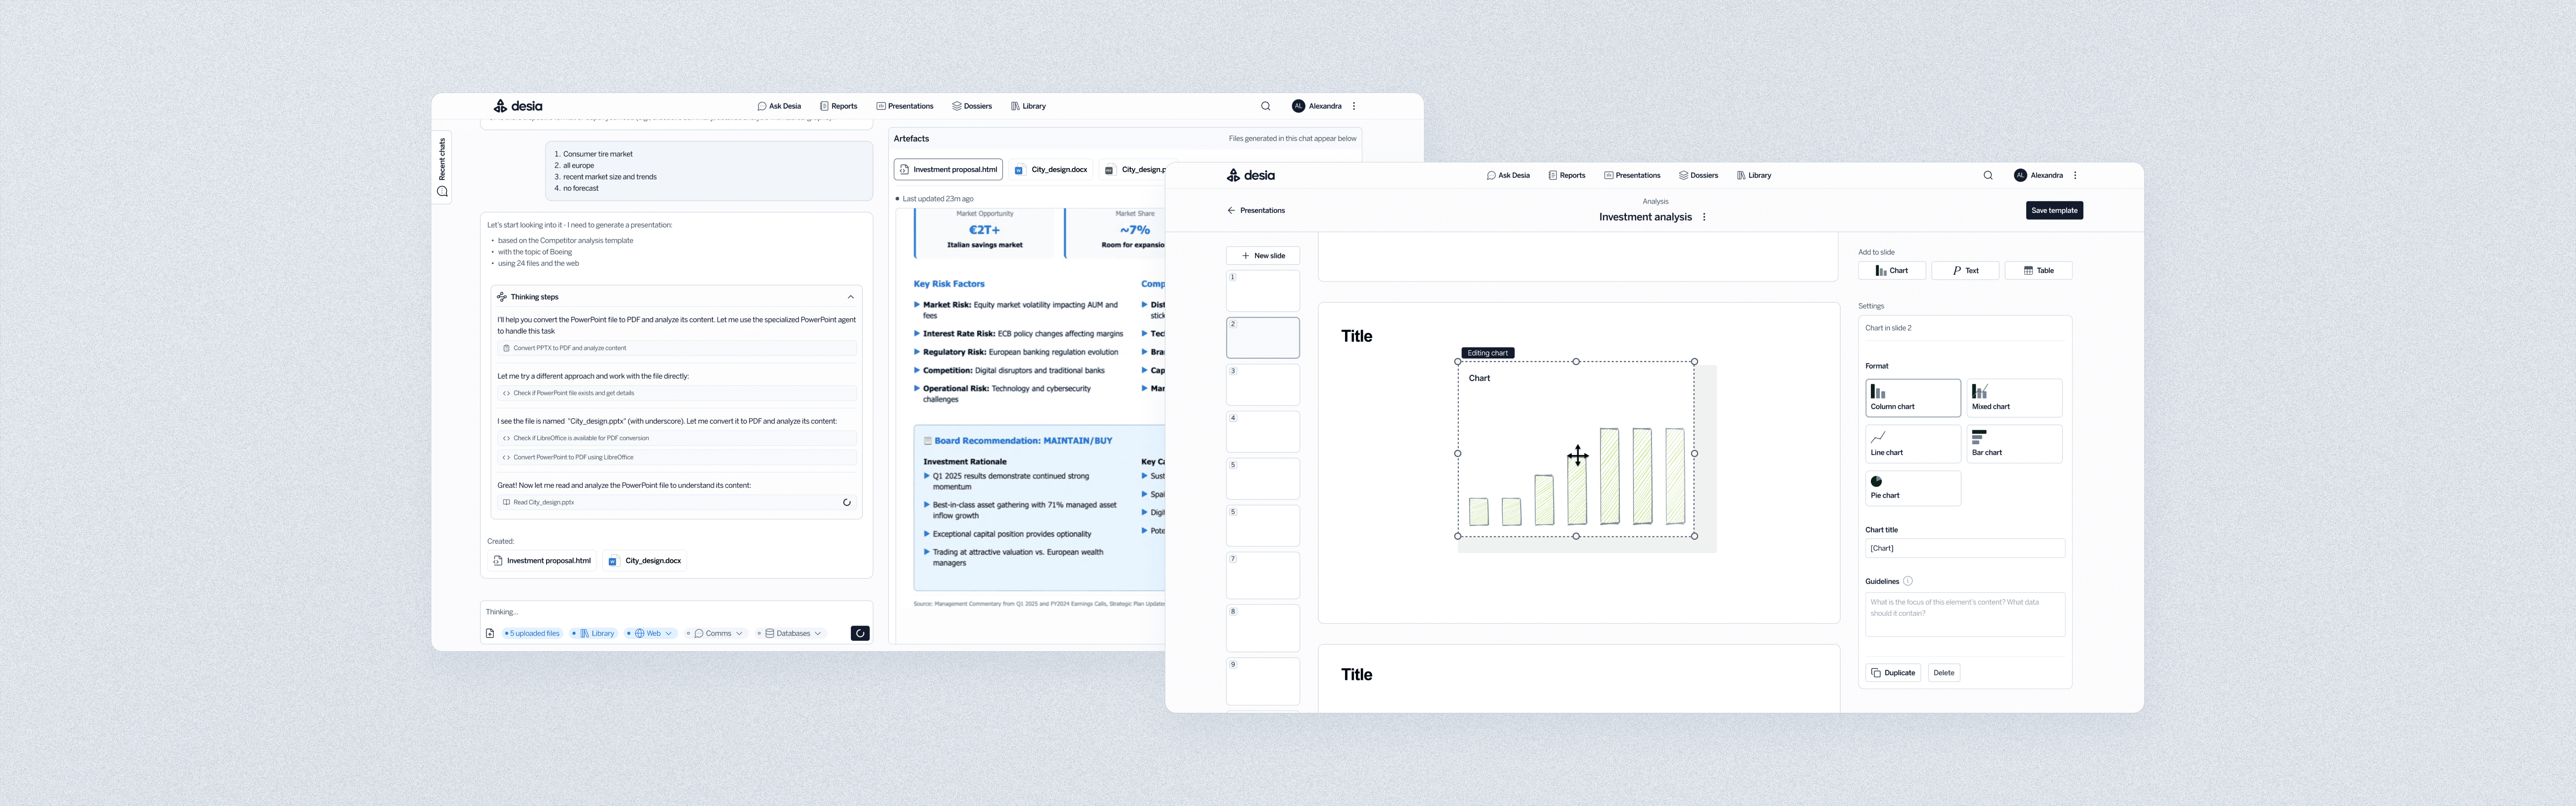
The most promising iterations were features supporting the creation of financial tables and PowerPoint presentations. Companies in finance often have strict templates, yet competitors’ AI outputs were too generic to be useful. By collaborating closely with engineers to understand how the system processes commands, I designed interfaces that explicitly ask for the necessary data, customising the AI to produce structured, accurate results. Through iterative testing internally and with industry users, these flows were refined until outputs matched professional standards.
Below is a PowerPoint template builder that emulates how advisors quickly sketch presentations on paper before sending them to juniors to arrange. The system then analyses past PDFs and using that file's branding template and tone, the structure and elements of this template, it can generate a new presentation for a given topic in the style and tone of the firm's past presentations. This project was an amazing example of leading with context understanding and design thinking; unfortunately, as this is a completely new product on the market representing a competitive advantage for the company, I cannot disclose more information as per NDA agreement.


Over time, we have designed and built multiple initiatives, each generating a different type of data. Observing all-in-one platform such as Lovable, I observed the benefits that a singular platform can have in terms of flexibility of generating any type of content, all while having everything in one place. Therefore, instead of having different parts of the website generate different types of content (short responses, tables, presentations) I discussed with the team combining all the interfaces into one where a user would have their project, their chosen sources, their messages with the system, and finally the output of their work.

Business impact and outcomes
As an early-stage startup, the team prioritised achieving product-market fit and optimising the technology. Quantitative metrics were not meaningful due to a small user base, hence I established continuous feedback loops to validate assumptions and ideas quickly, in addition to improving on existing functionality based on their feedback.
Weekly sessions and demos revealed that users consistently considered our platform to have an intuitive UX compared to other AI and/or research tools they have used. They highlighted its clear, straightforward structure and minimalism in visual design. This became a competitive differentiator during sales conversations, helping the company win deals against competitors offering similar capabilities with less usable interfaces.
By 2025, the company has acquired eight clients including Averroes Capital and US, Italy and UK firms. Currently, three major international financial institutions that I cannot name under NDA (energy sector, investment bank in APAC and another investment bank in the US) are in the process of signing with the company, each citing our structured approach, template-aligned process and the platform’s transparency and data correctness as key factors.
Finally, our existing users praise the ease of reaching data quickly - be it in their internal files or external databases or Web, they can find the information they need, verify it through a simple click to check sources, then turn this data into their template exports.