
2021-2023
Working with engineers in a research-led approach to make income assesments fair
About the product
Assess is a financial tool developed by the scale-up Bud Financial Ltd. It enables lenders to evaluate a customer’s loan affordability by leveraging open banking technology to analyse transaction data.
Assess helps clients increase revenue by improving the accuracy of lending decisions and ensuring timely loan repayments. This is done by analysing transactions via open banking to display a list of insights and indicators, helping advisors quickly identify and approve customers with strong affordability profiles while maintaining a balance between precision and efficiency.
My responsibilities
As the only designer of the team, I oversaw the end to end design roadmap of the product. My responsibilities included:
Leading the research and design of the product
Designing UX/UI through prototypes, wireframes, Figma high fidelity designs
Co-planning and leading product roadmap with Product manager of the team
Facilitating product workshops between teams to co-design products down to the technical details to discuss features and the action plan of each iteration
Designing and leading the development of the company’s design system
For financial advisors, analysing a customer's income is crucial when assessing loan affordability. Stable, substantial income signals the ability to repay debts reliably. With open banking, advisors can now see 180 days worth of transactions including incoming payments. Stable salaries are easy to asses, but in today's gig economy many people have multiple sources of income and irregular payments, meaning there needs to be structure to assessing fluctuations to avoid biases and only offer loans to customers that can pay it back in time.
What problem are we really solving?
After conducting user interviews with both our clients and external participants to understand how effective the product is, I’ve found a common theme: underwriters spend considerable time assessing income transactions individually. This is crucial information, as senior financial executives rate validating and verifying income as the most important step in the lending process (according to a 2022 lending survey).

In an affinity mapping workshop with the Product manager, we have organised feedback and discovered that lenders focus on income stability to predict future financial capacity. This is all broken down in the diagram below, which reveals that if income assessment is simplified, the advisor would not have to continue investigating income transactions further, advisors can save time and enhance efficiency by optimising for favourable outcomes.
How do show the right information at the right time?
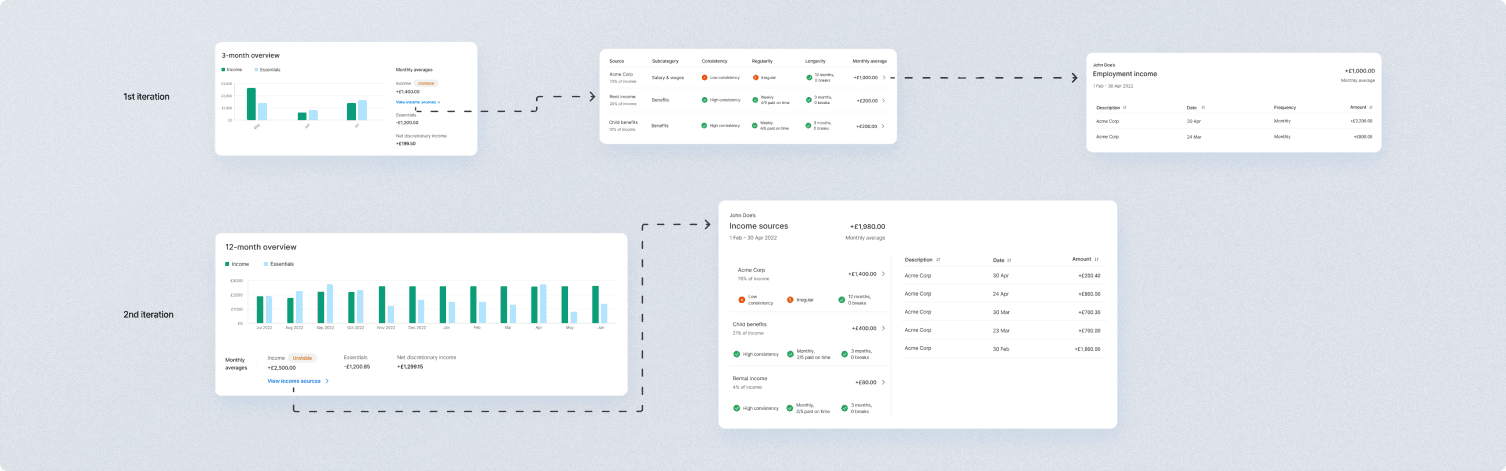
Initially, our lending dashboard only showed ‘static’ data, like snapshots, overall figures and monthly averages. However, advisors are actually looking for trends and patterns instead, which graphs are a great way to visualise. To avoid overwhelming users with too many graphs, I sought ways to optimise their utility. According to research, the second most important step in lending assessments is to assess how much money the customer has left over after essentials come out of their income. I added a chart displaying both income and essential spending at a glance that allows advisors to assess income stability, fluctuations, and overspending instances at the same time.
If an advisor notices consistent income, they move on to later stages of the assessment, skipping individual transaction checks. Otherwise, they examine the changes in amount, frequency, and longevity of income. Income scores, simplified through red-amber-green flags, indicating variability, regularity, and longevity provide this information at glance.
I’ve set up more client calls to explore this idea as well as discussed how they handle various scenarios. Clients revealed flexibility in assessing customer behaviour, as it turns out, the key is to show the right information at the right time. For example, ‘good income’ must be highlighted early in the income assessment, which they confirmed that the proposed design achieved.

How can we imrpove this further?
With the design on track, I've begun defining its specifics. What potential edge cases might we encounter?
A customer whose fluctuating income sources add up to be consistent monthly
A customer whose irregular salary might still meet loan qualifications, depending on the lending company's risk tolerance
According to research, advisors must then assess the different sources of income separately and grasp transaction patterns. I worked closely with the Back End team to understand the data we had available, constrained by open banking data sharing standards dictating API responses from banks. I also collaborated with the Front End team to ensure the graph's responsiveness and usability across devices
Delivery
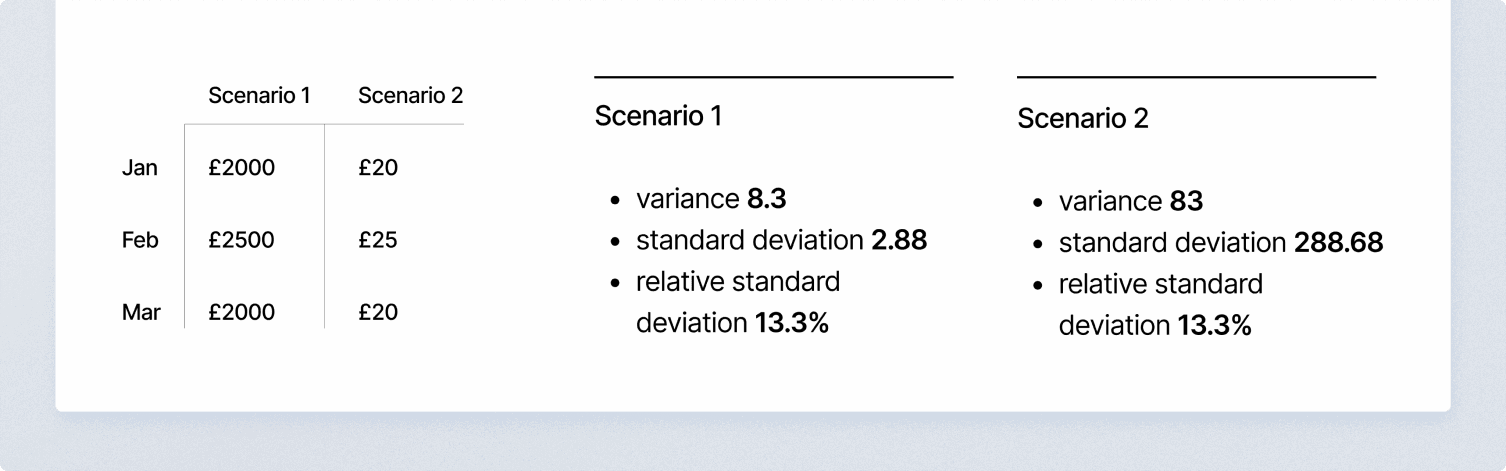
At first, the Back End team exclusively handled the calculation specifics for stability, regularity, and longevity using standard statistical formulas integrated into our API. However, during QA testing, we discovered that even stable salaries were inaccurately flagged as unstable. Recognising the critical impact of the very formulas on user experience and end customers' financial well-being, I decided to get involved and address this issue. Below is an example of how calculations applied to different scenarios can affect the flags shown to advisors.
B2B2C products require a delicate balance between revenue generation and customer responsibility. Changes in legislation increased financial companies' liabilities for knowingly lending to financially vulnerable customers. While this aspect deserves a separate discussion, in short I have closely collaborated with the Product Manager to determine the formulas and presentation of the statistical information, guided by research data and awareness of user need priorities.
Business impact and results
We have become a leading UK solution for income assessments, securing deals of £150k with companies like TSB, TransUnion, TotallyMoney and others looking to use our solution for income and expenses assessments in their lending pipeline (team & company OKR)
Our product’s NPS score increased from 7.5 to 9 (company OKR) with clients praising the time-saving benefits of our quick and accurate insights over manual bank statement assessments (team OKR)
‘If income is regular and consistent we wouldn’t need to drill down further into the transactions view’
‘seeing income plotted against essential spending on a month by month basis is way more useful than a single average figure’